


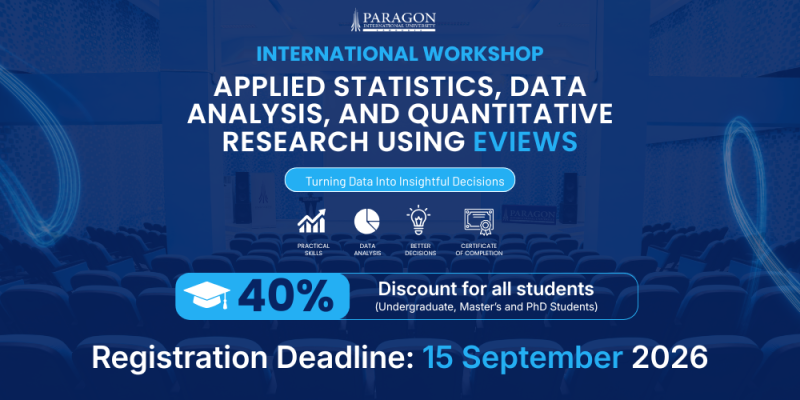
Paragon International University’s Center for Professional Education (CPE) invites you to join our upcoming International Workshop on “Applied Statistics, Data Analysis, and Quantitative Research Using EViews.”
Whether you are a researcher, professional, or student, this comprehensive 15-day workshop is designed to equip you with the practical skills needed to transform complex datasets into clear, actionable decisions.
This course is designed for:
- Undergraduate and postgraduate students (Economics, Banking, Finance, marketing, HR, Management, Engineering, Political Science, IR, Education, Medical, etc)
- PhD scholars
- University lecturers
- Researchers
- Thesis and dissertation writers
- Government and NGO professionals
- Policy analysts
- Business and finance professionals
Registration Information
Duration: 15 Days
- Dates: 20 September – 6 October 2026
- Time: 10:00 AM – 2:00 PM
- Venue: Paragon International University, Phnom Penh, Cambodia
- Registration Deadline: 15 September 2026
- Registration Fee: USD 100
The following discounts are available:
- 40% discount for all students (undergraduate, master’s, and PhD students).
- 25% discount for Paragon Company staff.
Participants are required to provide a valid student or employee identification card to be eligible for the applicable discount.
Textbooks
- David Spiegelhalter – The Art of Statistics: How to Learn from Data
- Herman Aguinis – Research Methodology: Best Practices for Rigorous, Credible, and Impactful Research
- Wooldridge – Introductory Econometrics: A Modern Approach EViews
Instructor: Prof. Dr. Kashif Hasan Khan
Head of the Department of Economics, Dean of the School of Graduate Studies, and Scientific Editor (Elsevier), Paragon International University, Phnom Penh, Cambodia.
Learning Outcomes
By the end of the course, students will be able to:
- Distinguish between cross-sectional, time series, and panel data.
- Estimate and interpret OLS regression models.
- Conduct hypothesis testing and interpret regression output.
- Diagnose and address common regression problems.
- Analyze time series data using ARIMA, ARDL, VAR, and VECM.
- Estimate and interpret panel data models (Pooled OLS, Fixed Effects, Random Effects).
- Understand the rationale for IV, 2SLS, and GMM in addressing endogeneity.
- Apply Logit, Probit, Poisson, and PPML models where appropriate.
Certificate
Participants who successfully complete the workshop will receive an Official Certificate of Completion issued by Paragon International University.
To qualify for the certificate, participants must:
- Attend at least 75% of the sessions.
- Complete the practical exercises and assignments (if applicable).
Module I – Foundations of applied Statistics and applied Econometrics
Day 1: Introduction to Applied Statistics, Econometrics & EViews
Theory
Part I – Applied Statistics Foundations
- Role of Statistics in Research
- Types of Variables (Categorical, Continuous, Binary)
- Levels of Measurement (Nominal, Ordinal, Interval, Ratio)
- Types of Data
- Cross-sectional
- Time Series
- Panel Data
- Population vs Sample
- Descriptive Statistics
- Mean
- Median
- Mode
- Variance
- Standard Deviation
- Z Scores
- Data Visualization
- Histogram
- Box Plot
- Scatter Plot
Part II – Introduction to Econometrics
- What is Econometrics?
- Why Econometrics?
- Economic Model vs Econometric Model
- Building an Econometric Model
- Research Process
- Introduction to Empirical Research
Practical (EViews)
- Introduction to EViews
- Creating Workfiles
- Importing Excel Data
- Managing Variables
- Descriptive Statistics
- Frequency Tables
- Histograms
- Box Plots
- Scatter Plots
- Correlation Matrix
Cross Sectional
Day 2: Simple Linear Regression
Theory
- Correlation vs Regression
- OLS concept
- Regression equation
- Interpretation of coefficients
- Goodness of fit
Practical
- Estimate simple regression
- Scatter plots
- Prediction
- Residuals
Day 3: Multiple Linear Regression
Theory
- Multiple regression model
- Dummy variables
- Interaction variables
- Functional forms
- Log-linear models
Practical
- Estimate multiple regression
- Interpret coefficients
- Compare models
Day 4: Statistical Inference
Theory
- Sampling distribution
- Standard errors
- Parametric Tests
- t-test
- F-test
- Non Parametric Tests
- Confidence intervals
- p-values
- R² and Adjusted R²
Practical
- Interpret EViews output
- Hypothesis testing
Day 5: Classical Linear Regression Assumptions
Theory
- Linearity
- Zero conditional mean
- Homoscedasticity
- No multicollinearity
- No autocorrelation
- Normality
- Model specification
Practical
- Residual analysis
- RESET Test
- Outlier detection
Module II – Regression Diagnostics
Day 6: Regression Problems & Solutions
Theory
- Heteroskedasticity
- Multicollinearity
- Autocorrelation
- Omitted variable bias
- Endogeneity (Introduction)
Practical
- White Test
- Breusch–Pagan Test
- VIF
- Durbin–Watson
- Breusch–Godfrey
Module III – Time Series Econometrics
Day 7: Time Series Basics
Theory
- Trend
- Seasonality
- Cycles
- Stationarity
- Spurious regression
Practical
- Time plots
- Correlogram
- Lag creation
Day 8: Unit Root & ARIMA
Theory
- Random walk
- ADF
- Phillips–Perron
- KPSS
- Differencing
- AR
- MA
- ARIMA
Practical
- Unit root testing
- Forecasting
Day 9: Cointegration & ARDL
Theory
- Cointegration
- Engle–Granger
- Johansen
- Error Correction Model
- ARDL
- NARDL (Introduction)
Practical
- Cointegration
- ARDL estimation
Day 10: VAR Models
Theory
- VAR
- VECM
- Granger Causality
- IRF
- FEVD
Practical
- Estimate VAR
- Impulse responses
- Variance decomposition
Module IV – Panel Data Econometrics
Day 11: Panel Data
Theory
- Balanced vs Unbalanced
- Pooled OLS
- Fixed Effects
- Random Effects
Practical
- Panel workfile
- Estimate FE & RE
Day 12: Advanced Panel Data
Theory
- Hausman Test
- Panel Unit Root
- Panel Cointegration
- Cross-sectional dependence
- Panel Granger Causality
Practical
- Panel diagnostics
Day 13: Advanced Econometrics
Theory
- Endogeneity
- Instrumental Variables (IV)
- Two-Stage Least Squares (2SLS)
- Dynamic Panels
- Difference GMM
- System GMM
- Hansen Test
- Arellano–Bond Test
Practical
- GMM interpretation
- Instrument validity
Module V – Special Models
Day 14: Limited Dependent Variable Models
Theory
- Logit
- Probit
- Tobit
- Poisson
- PPML
- Quantile Regression (Introduction)
Practical
- Estimate Logit
- Estimate Poisson
- PPML example
Day 15: Project
Students complete a full empirical study.
- Select research question
- Import data
- Descriptive statistics
- Estimate model
- Diagnostics
- Robustness
- Interpretation
- Policy implications
- Presentation